Why?
Some time ago I’ve used interesting Google Chrome extension named https://github.com/dejan/rails_panel for checking sql logs, exceptions and queries in your Google Chrome devtools. It looks amazing, and really cool.
But sometimes I just need to check development.log logs in my browser console without any additional info and complex UI things, and of course without swithing to my terminal with server output.
In this case I’ve created a small fork of rails_panel gem with some changes: https://github.com/maratgaliev/conductor and my fork of meta_request gem - https://github.com/maratgaliev/rails_panel.
You can install it into your Chrome browser via extensions settings (don’t forget to enable developer mode):
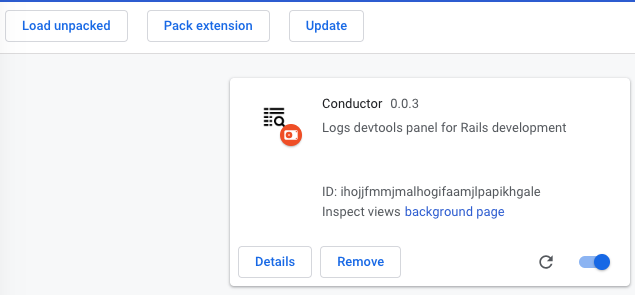
Current version is early alpha just to show how it works, and extension for Chrome not published for example, you can add it manually.
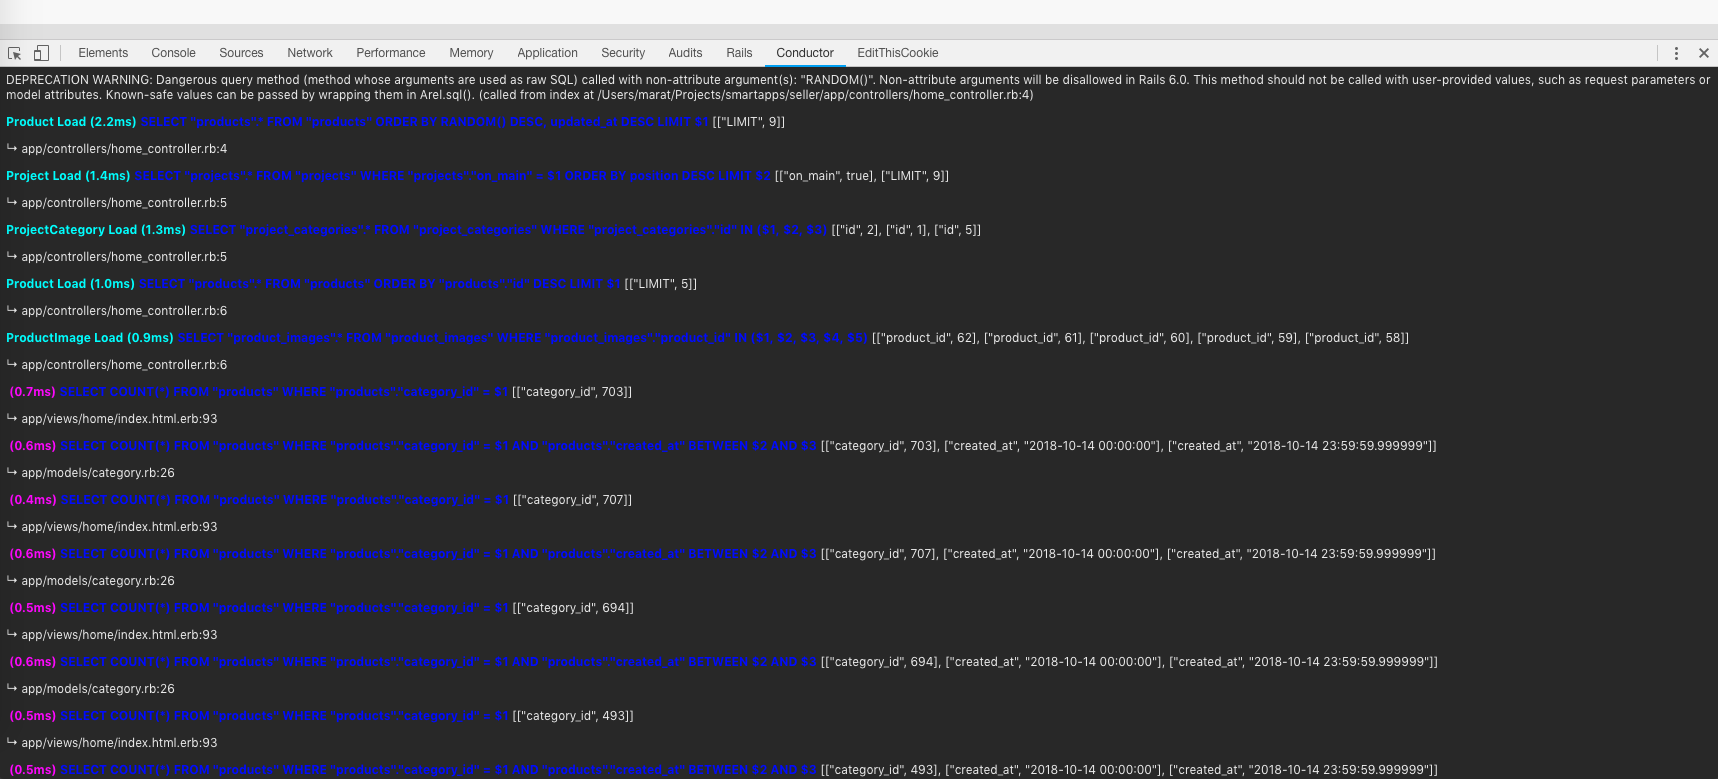
For now it looks like:
Let’s build our extension!
Google chrome extension directory structure
~/P/s/c/conductor ❯❯❯ tree
.
├── assets
│   ├── images
│   │   ├── logo_128.png
│   │   ├── logo_16.png
│   │   ├── logo_48.png
│   │   └── toolbar.png
│   ├── javascripts
│   │   ├── angular.js
│   │   ├── ansi2html.js
│   │   ├── background.js
│   │   ├── devtools.js
│   │   ├── filters.js
│   │   ├── init.js
│   │   ├── jquery.js
│   │   ├── panel.js
│   │   ├── requests.js
│   │   ├── sugar.js
│   │   ├── transactions.js
│   │   └── uri.js
│   └── stylesheets
│       └── custom.css
├── devtools.html
├── manifest.json
└── view.html

4 directories, 20 files
~/P/s/c/conductor ❯❯❯
Let’s create our manifest.json file first:
{
  "name": "Conductor",
  "version": "0.0.3",
  "manifest_version": 2,
  "description": "Logs devtools panel for Rails development",
  "devtools_page": "devtools.html",
  "background": {
    "scripts": [
      "assets/javascripts/jquery.js",
      "assets/javascripts/background.js"
    ]
  },
  "permissions": [
    "http://*/*",
    "https://*/*"
  ],
  "icons": {
    "16": "assets/images/logo_16.png",
    "48": "assets/images/logo_48.png",
   "128": "assets/images/logo_128.png"
 }
}
Main view of our extension with all assets included and ng-* directives:
<html ng-app="Conductor" ng-csp="">
  <head>
    <link rel="stylesheet" type="text/css" href="assets/stylesheets/custom.css">
    <script src="assets/javascripts/jquery.js"></script>
    <script src="assets/javascripts/sugar.js"></script>
    <script src="assets/javascripts/uri.js"></script>
    <script src="assets/javascripts/ansi2html.js"></script>
    <script src="assets/javascripts/angular.js"></script>
    <script src="assets/javascripts/filters.js"></script>
    <script src="assets/javascripts/transactions.js"></script>
    <script src="assets/javascripts/panel.js"></script>
    <script src="assets/javascripts/requests.js"></script>
    <script src="assets/javascripts/init.js"></script>
  </head>
  <body class="conductor">
      <div id="main_view" ng-controller='TransactionsController'>
        <div id="log" ng-show="notEmpty(devLog())">
          <div ng-repeat="log in devLog()">
            <p ng-bind-html-unsafe="log.payload.message | ansi2html"></p>
          </div>
        </table>
      </div>
    </body>
</html>
Our devtools.js file contains main view for our extension:
chrome.devtools.panels.create("Conductor", "assets/images/toolbar.png", "view.html");
For the colorful output we can enable filter for our Angular module like in filters.js file:
angular.module('Conductor', [])
  .directive('ngHtml', function() {
    return function(scope, element, attrs) {
      scope.$watch(attrs.ngHtml, function(value) {
        element[0].innerHTML = value;
      });
    }
  }).
  filter('ansi2html', function() {
    return function(input) {
      if(input != null) {
        return ansi2html(input);
      }
    }
});
And init.js to initialize our Angular app and controller in our #main_view container:
$(function() {
  var scope = angular.element('#main_view').scope();
  new TransactionsController(scope);
  requests.bindListener(scope);
});
Main extension logic described in transactions.js file in TransactionsController function.
New devLog function for collecting logs with special key.
function TransactionsController($scope) {

  // ...
  $scope.logsMap             = {}; // {transactionKey: [{...}, {...}], ... }
  $scope.devlogsMap          = {}; // {transactionKey: [{...}, {...}], ... }
  // ...

  $scope.clear = function() {
    // ...
    $scope.logsMap = {};
    $scope.devlogsMap = {};
    // ...
  }

  // ...

  $scope.activeLog = function() {
    return $scope.logsMap[$scope.activeKey];
  }

  $scope.devLog = function() {
    return $scope.devlogsMap[$scope.activeKey];
  }

  // ...

  $scope.parseNotification = function(key, data) {
    switch(data.name) {

    // ...

    case "meta_request.devlog":
      $scope.pushToMap($scope.devlogsMap, key, data);
      break;
    case "meta_request.log":
      $scope.pushToMap($scope.logsMap, key, data);
      break;

    // ...

    default:
      console.log('Notification not supported:' + data.name);
    }
  }

  // ...

}
Net thing - changes it meta_request gem.
Let’s add new initializer first in railtie.rb:
initializer 'meta_request.log_reader' do
  Rails.logger.extend(LogReader)
end
And new LogReader module.
require 'callsite'

module MetaRequest
  module LogReader

    private
    def push_event(level, message)
      c = Callsite.parse(caller[1])
      payload = {:message => message, :level => level, :line => c.line, :filename => c.filename, :method => c.method}
      AppRequest.current.events << Event.new('meta_request.devlog', 0, 0, 0, payload)
    rescue Exception => e
      MetaRequest.logger.fatal(e.message + "\n " + e.backtrace.join("\n "))
    end
  end
end
Let’s add new notification type in app_notifications.rb file:
    def self.subscribe
      new.
        # ...
        subscribe("meta_request.log").
        subscribe("meta_request.devlog").
        # ...
    end
Looks like we’re done! Simple hacks and we can view our Rails logs directly in our Google Chrome development tools tab named Conductor.