Perfomance problems.
Just two words - a lot of spent time to find and resolve a bootlenecks.
In this article I would like to go through popular profiling tools and show how you can use them to find and resolve your perfomance problems.
First of all, I think we can swap all profilers to different groups: CPU usage/profiling, memory usage/profiling.
ruby-prof
Link: https://github.com/ruby-prof/ruby-prof
ruby-prof is a fast code profiler for MRI Ruby. Super simple. Super fast.
Just add simple start expression and your code inside block.
irb(main):001:0> RubyProf.start
irb(main):002:0> Job.last(3)
irb(main):003:0> result = RubyProf.stop
irb(main):004:0> pretty = RubyProf::FlatPrinter.new(result)
On next step, let’s check our pretty print:
irb(main):005:0> pretty.print(STDOUT)
Measure Mode: wall_time
Thread ID: 70334758006380
Fiber ID: 70334777964160
Total: 53.920106
Sort by: self_time

 %self      total      self      wait     child     calls  name
 90.29     53.767    48.686     5.080     0.000        2   Readline#readline
  0.04      0.021     0.021     0.000     0.000       10   PG::Connection#async_exec
  0.02      0.012     0.012     0.000     0.000      380   Module#module_eval
  0.02      0.011     0.011     0.000     0.000        2   PG::Connection#async_exec_params
  0.01      0.007     0.007     0.000     0.000        1   PG::Connection#initialize
  0.01      0.008     0.007     0.000     0.002       12   <Module::Bootsnap::CompileCache::Native>#fetch
  0.01      0.003     0.003     0.000     0.000        6   <Class::Time>#utc
  0.00      0.003     0.003     0.000     0.000      234   <Class::File>#stat
  0.00      0.002     0.002     0.000     0.000        1   PG::Connection#async_exec_prepared
  0.00      0.002     0.002     0.000     0.000        1   <Class::PG::Connection>#conndefaults
  0.00      0.002     0.002     0.000     0.000      813   <Class::File>#expand_path
  ...
  0.00      0.000     0.000     0.000     0.000        1   Arel::Collectors::Bind#value
  0.00      0.000     0.000     0.000     0.000        1   Kernel#lambda
  0.00      0.000     0.000     0.000     0.000        1   Module#singleton_class?
  0.00      0.000     0.000     0.000     0.000        1   Arel::Collectors::Bind#add_bind
  0.00      0.000     0.000     0.000     0.000        2   Hash#except!
  0.00      0.000     0.000     0.000     0.000        1   ActiveRecord::QueryMethods#where_clause
  0.00      0.000     0.000     0.000     0.000        6   Kernel#instance_of?
  0.00      0.000     0.000     0.000     0.000        1   ActiveRecord::QueryMethods#having_clause
  0.00      0.000     0.000     0.000     0.000        1   Arel::SelectManager#project
  0.00      0.000     0.000     0.000     0.000        1   Kernel#=~

* indicates recursively called methods
Measure Mode: wall_time
Thread ID: 70334833056180
Fiber ID: 70334781354280
Total: 5.081045
Sort by: self_time

 %self      total      self      wait     child     calls  name
 99.98      5.081     5.080     0.001     0.000        1   Kernel#sleep
  0.00      0.000     0.000     0.000     0.000        1   ActiveRecord::ConnectionAdapters::ConnectionPool#reap
  0.00      0.000     0.000     0.000     0.000        2   MonitorMixin#mon_synchronize
  0.00      0.000     0.000     0.000     0.000        2   MonitorMixin#mon_enter
  0.00      0.000     0.000     0.000     0.000        2   Array#select
  0.00      5.081     0.000     0.000     5.081        1   ActiveRecord::ConnectionAdapters::ConnectionPool::Reaper#run
  0.00      0.000     0.000     0.000     0.000        6   <Class::Thread>#current
  0.00      0.000     0.000     0.000     0.000        2   MonitorMixin#mon_exit
  0.00      0.000     0.000     0.000     0.000        1   ActiveRecord::ConnectionAdapters::ConnectionPool#flush
  0.00      0.000     0.000     0.000     0.000        2   MonitorMixin#mon_check_owner
  0.00      0.000     0.000     0.000     0.000        4   Array#each
  0.00      0.000     0.000     0.000     0.000        2   Thread::Mutex#lock
  0.00      0.000     0.000     0.000     0.000        2   Thread::Mutex#unlock
  0.00      0.000     0.000     0.000     0.000        1   Thread#alive?
  0.00      0.000     0.000     0.000     0.000        1   Kernel#nil?
As you can see, result contains a lot of useful info like execution time, usage percentage and calls count.
perftools
Link: https://github.com/tmm1/perftools.rb
Outdated gem and it not working on my 2.5.1 ruby, you can check website and sample execution image:
stackprof
Link: https://github.com/tmm1/stackprof
A sampling call-stack profiler for Ruby.
This gem inspired heavily by gperftools, and written as a replacement for perftools.rb.
Running via Spring preloader in process 8681
Loading development environment (Rails 5.2.2)
irb(main):001:0> StackProf.run(mode: :cpu, out: 'tmp/stackprof.dump') do
irb(main):002:1* Job.last(3)
irb(main):003:1> end
  Job Load (3.9ms)  SELECT  "jobs".* FROM "jobs" ORDER BY "jobs"."id" DESC LIMIT $1  [["LIMIT", 3]]
=> #<File:tmp/stackprof.dump>
irb(main):004:0>
Let’s see GC usage and CPU:
❯❯❯ stackprof tmp/stackprof.dump --text --limit 1
==================================
  Mode: cpu(1000)
  Samples: 82 (0.00% miss rate)
  GC: 46 (56.10%)
==================================
     TOTAL    (pct)     SAMPLES    (pct)     FRAME
        46  (56.1%)          46  (56.1%)     (garbage collection)
Nice, but we need more visialization, right? Say no more.
irb(main):001:0> StackProf.run(mode: :cpu, out: 'tmp/stackprof.dump', raw: true) do
irb(main):002:1* Job.last(3)
irb(main):003:1> end
  Job Load (1.5ms)  SELECT  "jobs".* FROM "jobs" ORDER BY "jobs"."id" DESC LIMIT $1  [["LIMIT", 3]]
=> #<File:tmp/stackprof.dump>
Create flamegraph file:
❯❯❯ stackprof --flamegraph tmp/stackprof.dump > tmp/flamegraph
And generate some graphical UI:
❯❯❯ stackprof --flamegraph-viewer=tmp/flamegraph
open file:///Users/marat/.rbenv/versions/2.5.1/lib/ruby/gems/2.5.0/gems/stackprof-0.2.12/lib/stackprof/flamegraph/viewer.html?data=/Users/marat/Projects/profileprj/tmp/flamegraph
Amazing colorful result:
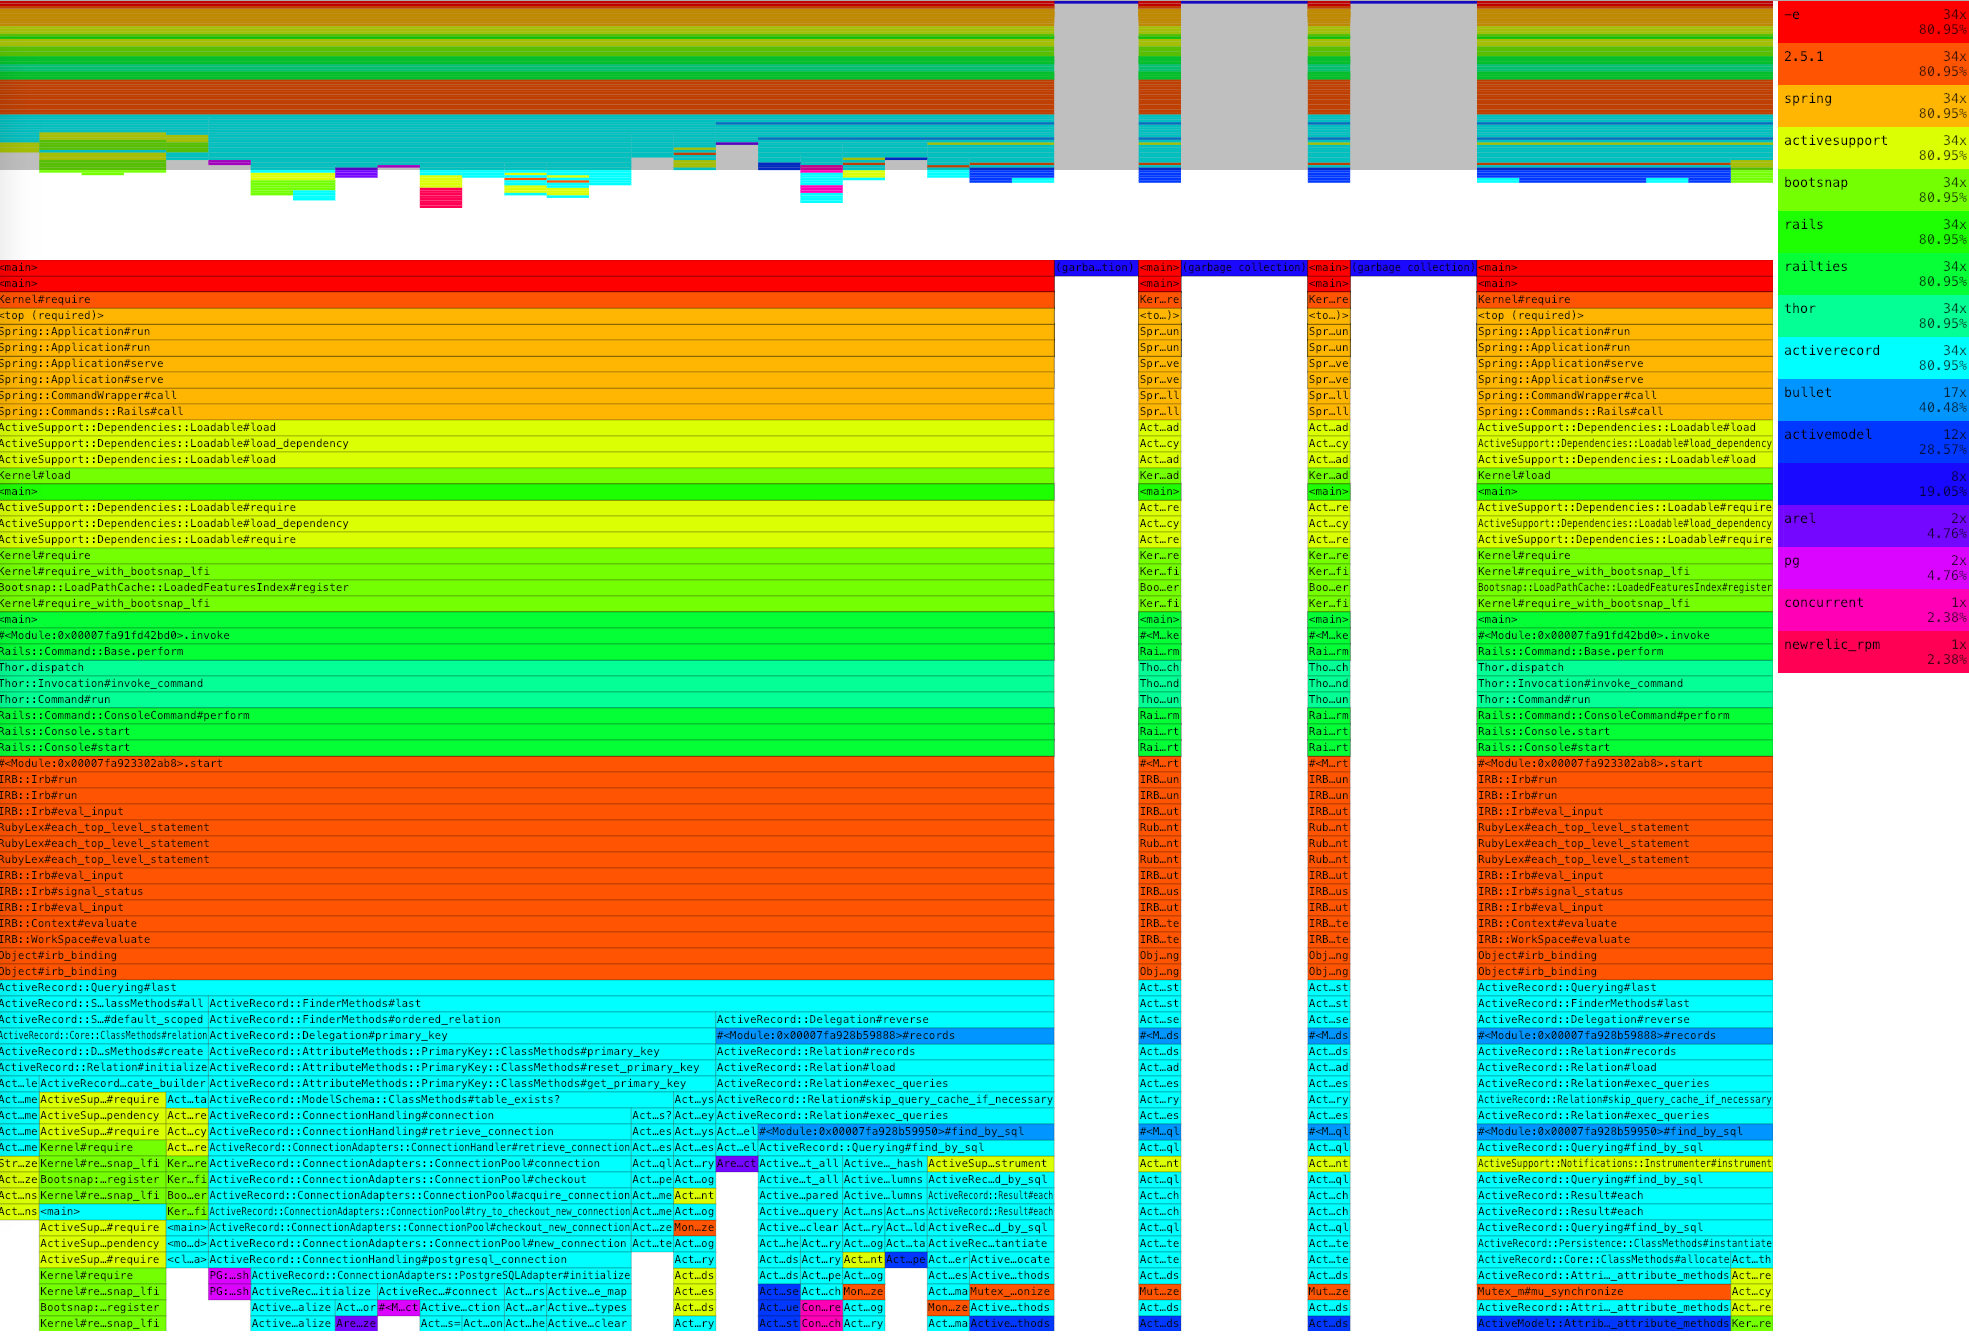
You can click on each line and see how much time and cpu usage use your project report and gems/modules.
Memory
In this section we try to check some memory profiling tools and options.
ObjectSpace and objspace.so
The ObjectSpace module contains a number of routines that interact with the garbage collection facility and allow you to traverse all living objects with an iterator.
ObjectSpace also provides support for object finalizers, procs that will be called when a specific object is about to be destroyed by garbage collection.
Let’s see how many objects we have now:
irb(main):001:0> ObjectSpace.count_objects
=> {:TOTAL=>42385, :FREE=>54, :T_OBJECT=>1802, :T_CLASS=>969, :T_MODULE=>48, :T_FLOAT=>4, :T_STRING=>27717, :T_REGEXP=>238, :T_ARRAY=>5166, :T_HASH=>186, :T_STRUCT=>12, :T_BIGNUM=>2, :T_FILE=>9, :T_DATA=>246, :T_MATCH=>97, :T_COMPLEX=>1, :T_SYMBOL=>5, :T_IMEMO=>5775, :T_ICLASS=>54}
Do you know small tips to control your GC ?
How control the GC:
GC.disable # GC is disabled
GC.enable # GC is enabled.
GC.start # start garbage collecting
Let’s check some numbers of our Job.limit(3) call.
def allocate_count
  GC.disable
  before = ObjectSpace.count_objects
  yield
  after = ObjectSpace.count_objects
  after.each { |k,v| after[k] = v - before[k] }
  after[:T_HASH] -= 1
  after[:FREE] += 1
  GC.enable
  after.reject { |k,v| v == 0 }
end

irb(main):012:0> allocate_count {Job.limit(3)}
=> {:FREE=>-8114, :T_OBJECT=>252, :T_CLASS=>24, :T_MODULE=>1, :T_STRING=>5171, :T_ARRAY=>791, :T_HASH=>20, :T_DATA=>784, :T_MATCH=>3, :T_IMEMO=>1068}
Nice, right? Also you can see data for some classes:
puts ObjectSpace.each_object.count #=> 29723
puts ObjectSpace.each_object(Numeric).count #=> 7
puts ObjectSpace.each_object(Complex).count #=> 1
Let’s enable GC::Profiler and check numbers:
irb(main):007:0> GC::Profiler.enable
irb(main):009:0> require 'set'
=> true
irb(main):010:0> GC.start
irb(main):012:0> GC::Profiler.report
GC 24 invokes.
Index    Invoke Time(sec)       Use Size(byte)     Total Size(byte)         Total Object                    GC Time(ms)
    1               0.340              1055760              1697280                42432         1.43499999999985305976
    2               0.342              1056480              1697280                42432         2.07899999999999751665
=> nil
irb(main):013:0> GC::Profiler.disable
=> nil
gc_tracer
Link: https://github.com/ko1/gc_tracer
Trace Garbage Collector activities and output statistics information.
This gem only supports MRI 2.1.0 and later.
Add line to your config.ru:
require_relative 'config/environment'
use Rack::GCTracerMiddleware, view_page_path: '/gc_tracer', filename: 'log/gc_tracer'
run Rails.application
Check log/gc_tracer:
type	tick	count	heap_allocated_pages	heap_sorted_length	heap_allocatable_pages	heap_available_slots	heap_live_slots	heap_free_slots	heap_final_slots	heap_marked_slots	heap_eden_pages	heap_tomb_pages	total_allocated_pages	total_freed_pages	total_allocated_objects	total_freed_objects	malloc_increase_bytes	malloc_increase_bytes_limit	minor_gc_count	major_gc_count	remembered_wb_unprotected_objects	remembered_wb_unprotected_objects_limit	old_objects	old_objects_limit	oldmalloc_increase_bytes	oldmalloc_increase_bytes_limit	major_by	gc_by	have_finalizer	immediate_sweep	state	ru_utime	ru_stime	ru_maxrss	ru_ixrss	ru_idrss	ru_isrss	ru_minflt	ru_majflt	ru_nswap	ru_inblock	ru_oublock	ru_msgsnd	ru_msgrcv	ru_nsignals	ru_nvcsw	ru_nivcsw	accesses
end_sweep	1550646039189034	48	1925	1987	62	784649	781089	3550	10	486095	1925	0	1925	0	1971479	1190380	23260240	22558230	38	10	3494	6984	471447	942900	23260240	24159190	oldmalloc	newobj	0	0	sweeping	2247489	889383	165928960	0	0	0	94431	295	0	0	0	0	0	5	7483	804	0
start	1550646039189058	49	1925	1987	62	784649	781089	3550	10	486095	1925	0	1925	0	1971479	1190380	0	32564335	38	10	3494	6984	471447	942900	0	23685480	0	malloc	0	0	none	2247499	889386	165928960	0	0	0	94431	295	0	0	0	0	0	5	7483	804	0
end_mark	1550646039198701	49	1925	1987	62	784649	781089	3550	10	610308	1925	0	1925	0	1971479	1190380	0	32564335	39	10	3804	6984	556322	942900	0	23685480	0	malloc	0	0	marking	2257046	889487	166043648	0	0	0	94459	295	0	0	0	0	0	5	7483	804	0
end_sweep	1550646049078440	49	1987	1987	0	809920	809261	659	0	610308	1987	0	1987	0	2170885	1361624	19627032	32564335	39	10	3808	6984	556317	942900	19627032	23685480	0	malloc	0	0	sweeping	2473694	999079	176517120	0	0	0	113977	306	0	0	0	58	127	7	7763	1127	1
start	1550646049078458	50	1987	1987	0	809920	809261	659	0	610308	1987	0	1987	0	2170885	1361624	0	31913048	39	10	3808	6984	556317	942900	19627032	23685480	0	newobj	0	0	none	2473704	999084	176517120	0	0	0	113977	306	0	0	0	58	127	7	7763	1127	1
end_mark	1550646049090182	50	1988	2758	770	810328	809261	1067	0	674592	1988	0	1988	0	2170885	1361624	0	31913048	40	10	4047	8094	606696	1213392	19627032	23685480	0	newobj	0	0	marking	2484693	999822	176517120	0	0	0	114922	306	0	0	0	58	127	7	7763	1127	1
end_sweep	1550646049735013	50	2441	2758	317	994974	976393	18581	0	674592	2441	0	2441	0	2472690	1496297	31019240	31913048	40	10	4047	8094	606695	1213392	50604224	23685480	0	newobj	0	0	sweeping	2715125	1238189	210255872	0	0	0	124628	306	0	0	0	58	127	7	9228	1458	1
start	1550646049763455	51	2441	2758	317	994974	984541	10433	0	674592	2441	0	2441	0	2480838	1496297	0	33554432	40	10	4047	8094	606695	1213392	51498672	28422576	0	malloc	0	0	none	2727224	1248815	211591168	0	0	0	124962	306	0	0	0	58	127	7	9292	1475	1
end_mark	1550646049781430	51	2441	2758	317	994974	984541	10433	0	789737	2441	0	2441	0	2480838	1496297	0	33554432	41	10	55792	8094	723801	1213392	51498672	28422576	0	malloc	0	0	marking	2744947	1248963	211636224	0	0	0	124987	306	0	0	0	58	127	7	9292	1490	1
end_sweep	1550646050033577	51	2441	2758	317	994974	891612	103362	0	789737	2441	0	2441	0	2582718	1691106	4343408	33554432	41	10	55793	8094	723800	1213392	40384464	28422576	0	malloc	0	0	sweeping	2885160	1328117	213868544	0	0	0	126216	386	0	0	0	58	127	7	9619	1801	1
start	1550646050033599	52	2441	2758	317	994974	891612	103362	0	789737	2441	0	2441	0	2582718	1691106	0	32883343	41	10	55793	8094	723800	1213392	40384464	34107091	shady	newobj	0	0	none	2885172	1328124	213868544	0	0	0	126216	386	0	0	0	58	127	7	9619	1801	1
end_mark	1550646050721913	52	2598	2758	160	1058964	1058178	786	0	805835	2598	0	2598	0	2749367	1691189	11291776	32883343	41	11	56510	113020	736313	1472626	51676240	34107091	shady	newobj	0	0	marking	3188866	1388155	221720576	0	0	0	129559	386	0	0	0	192	216	7	9767	3265	36
Also you can use block for that:
irb(main):013:0> GC::Tracer.start_logging do
irb(main):014:1* any heavy calculations
irb(main):015:1> end
derailed_benchmarks
Link: https://github.com/schneems/derailed_benchmarks
A series of things you can use to benchmark a Rails or Ruby app.
bundle exec derailed bundle:mem
Amazing detailed output with each gem and mem usage!
❯❯❯ bundle exec derailed bundle:mem
TOP: 94.3242 MiB
  rails/all: 25.957 MiB
    rails: 11.5313 MiB (Also required by: active_record/railtie, active_model/railtie, and 10 others)
      active_support/railtie: 4.9141 MiB
        active_support/i18n_railtie: 4.8789 MiB
          active_support/file_update_checker: 3.0 MiB (Also required by: rails/application/configuration)
            active_support/core_ext/time/calculations: 2.9648 MiB (Also required by: active_support/core_ext/time, active_support/core_ext/numeric/time)
              active_support/core_ext/time/conversions: 1.7109 MiB (Also required by: active_support/core_ext/time, active_support/core_ext/date_time/conversions)
                active_support/values/time_zone: 1.6758 MiB (Also required by: active_support/time_with_zone, active_support/core_ext/date_time/conversions)
                  tzinfo: 1.4141 MiB
              active_support/duration: 0.6016 MiB (Also required by: active_support/time_with_zone, active_support/core_ext/date/calculations, and 2 others)
                active_support/core_ext/array/conversions: 0.3086 MiB (Also required by: active_support/core_ext/object/conversions, active_model/errors, and 3 others)
          rails/railtie/configuration: 1.832 MiB (Also required by: rails/engine/configuration)
            rails/configuration: 1.7852 MiB
              active_support/core_ext/object: 1.7148 MiB
                active_support/core_ext/object/conversions: 0.7969 MiB
                  active_support/core_ext/hash/conversions: 0.7695 MiB (Also required by: /Users/marat/.rbenv/versions/2.5.1/lib/ruby/gems/2.5.0/gems/activesupport-5.2.2/lib/active_support/core_ext/hash.rb, active_model/serializers/xml)
                    active_support/time: 0.6211 MiB (Also required by: active_record/base)
                active_support/core_ext/object/json: 0.7578 MiB (Also required by: active_support/json/encoding)
                  json: 0.6406 MiB (Also required by: active_support/json/decoding, sprockets/bower, and 27 others)
                    json/common: 0.5664 MiB (Also required by: json/ext)
                      json/version: 0.3867 MiB (Also required by: json)
      active_support: 3.5781 MiB (Also required by: active_support/railtie, active_support/i18n_railtie, and 16 others)
        active_support/logger: 2.3398 MiB
          active_support/logger_silence: 2.3203 MiB
            concurrent: 2.2461 MiB (Also required by: sprockets/manifest)
              concurrent/promises: 0.6289 MiB
              concurrent/configuration: 0.4492 MiB (Also required by: concurrent/scheduled_task, concurrent/options, and 2 others)
              concurrent/agent: 0.3203 MiB
              concurrent/executors: 0.3125 MiB
        active_support/dependencies/autoload: 1.207 MiB (Also required by: rails, active_support/rails, and 2 others)
          active_support/inflector/methods: 1.207 MiB (Also required by: active_support/inflector, active_support/core_ext/string/inflections, and 4 others)
            active_support/inflections: 1.1602 MiB (Also required by: active_support/inflector)
              active_support/inflector/inflections: 1.1172 MiB (Also required by: active_support/inflector)
                active_support/deprecation: 0.6641 MiB (Also required by: rails/application, active_support/duration, and 4 others)
      rails/application: 2.8047 MiB
        active_support/key_generator: 1.7031 MiB (Also required by: action_dispatch/middleware/cookies)
          openssl: 1.6992 MiB (Also required by: active_support/message_encryptor, http/options, and 12 others)
            openssl/ssl: 0.9648 MiB
            openssl.so: 0.6992 MiB
        yaml: 0.4531 MiB (Also required by: active_support/encrypted_configuration, rails/secrets, and 5 others)
          psych: 0.4531 MiB
        rails/engine: 0.3281 MiB (Also required by: coffee/rails/engine, acts-as-taggable-on)
    sprockets/railtie: 9.3711 MiB (Also required by: sass/rails/railtie)
      sprockets/rails/context: 5.8594 MiB
        action_view/helpers: 5.8164 MiB (Also required by: action_view/base)
          action_view/helpers/form_helper: 3.9219 MiB (Also required by: action_view/helpers/form_options_helper)
            action_view/helpers/form_tag_helper: 3.4414 MiB
              action_view/helpers/text_helper: 2.957 MiB
                action_view/helpers/sanitize_helper: 2.8438 MiB
                  rails-html-sanitizer: 2.8125 MiB
                    loofah: 2.6914 MiB
                      nokogiri: 2.4297 MiB (Also required by: aws-sdk-core/xml/parser/engines/nokogiri)
                        nokogiri/xml: 1.0977 MiB
                          nokogiri/xml/syntax_error: 0.4922 MiB
                        nokogiri/html: 0.5039 MiB
                          nokogiri/html/element_description_defaults: 0.3867 MiB
                        nokogiri/css: 0.3633 MiB
                          nokogiri/css/parser: 0.3008 MiB
          action_view/helpers/asset_tag_helper: 0.5469 MiB
          action_view/helpers/date_helper: 0.4336 MiB (Also required by: action_view/helpers/form_helper)
      sprockets: 3.2305 MiB (Also required by: sprockets/rails/context, sprockets/rails/helper)
        sprockets/environment: 1.5156 MiB
          sprockets/base: 1.4219 MiB (Also required by: sprockets/cached_environment, sprockets/legacy)
            sprockets/configuration: 0.75 MiB (Also required by: sprockets)
    active_record/railtie: 3.5273 MiB
      active_record: 2.2305 MiB (Also required by: active_storage, orm_adapter/adapters/active_record, and 2 others)
        active_record/connection_adapters/abstract_adapter: 1.0586 MiB
          active_record/connection_adapters/abstract/schema_statements: 0.4336 MiB
        arel: 0.832 MiB
          arel/visitors: 0.4648 MiB
      action_controller/railtie: 1.2188 MiB (Also required by: rails/all, sprockets/railtie)
        action_controller: 0.9297 MiB (Also required by: responders, ransack)
          action_controller/metal/live: 0.625 MiB
            action_dispatch/http/response: 0.5898 MiB (Also required by: action_controller/metal)
              rack/response: 0.3594 MiB (Also required by: rack/session/abstract/id)
                rack/request: 0.332 MiB (Also required by: action_dispatch/http/request, rack/session/abstract/id)
    active_storage/engine: 0.8789 MiB
      action_dispatch/routing/route_set: 0.7656 MiB
        action_dispatch/journey: 0.4258 MiB
          action_dispatch/journey/router: 0.3359 MiB
    rails/test_unit/railtie: 0.5313 MiB
      rails/test_unit/line_filtering: 0.5156 MiB
        rails/test_unit/runner: 0.5156 MiB
          rake/file_list: 0.5039 MiB
  carrierwave-aws: 10.3398 MiB
    carrierwave/storage/aws: 10.3281 MiB
      aws-sdk-s3: 10.3242 MiB
        aws-sdk-kms: 3.625 MiB
          aws-sdk-core: 2.4844 MiB (Also required by: aws-sdk-s3)
            aws-sdk-sts: 0.5781 MiB
            seahorse: 0.4063 MiB
  twitter: 10.1914 MiB
    twitter/cursor: 4.9922 MiB (Also required by: twitter/rest/utils, twitter/rest/friends_and_followers, and 2 others)
      twitter/rest/request: 4.9883 MiB (Also required by: twitter/rest/utils, twitter/rest/friends_and_followers, and 8 others)
        http: 4.875 MiB (Also required by: twitter/streaming/response)
          http/response: 3.5 MiB
            http/cookie_jar: 3.0078 MiB
              http/cookie: 2.9102 MiB
                domain_name: 2.7695 MiB
                  domain_name/etld_data: 2.6016 MiB
            http/response/status: 0.3242 MiB
          http/client: 0.8242 MiB (Also required by: http/response/body)
            http/options: 0.5273 MiB (Also required by: http)
              http/uri: 0.3672 MiB (Also required by: http/client, http/request)
    twitter/rest/client: 2.1641 MiB
      twitter/rest/api: 2.082 MiB
        twitter/rest/direct_messages: 0.4023 MiB
          twitter/rest/utils: 0.3125 MiB (Also required by: twitter/rest/favorites, twitter/rest/friends_and_followers, and 13 others)
    twitter/streaming/client: 1.4063 MiB
      twitter/streaming/connection: 1.1523 MiB
        resolv: 1.0859 MiB (Also required by: new_relic/agent)
    addressable/uri: 0.6406 MiB (Also required by: twitter/base, twitter/rest/request, and 6 others)
    twitter/direct_message: 0.3438 MiB (Also required by: twitter/rest/direct_messages, twitter/streaming/message_parser)
      twitter/entities: 0.3164 MiB (Also required by: twitter/tweet)
  newrelic_rpm: 8.6406 MiB
    new_relic/control: 8.6055 MiB
      new_relic/agent: 8.043 MiB
        new_relic/agent/agent: 4.1094 MiB
          new_relic/agent/configuration/manager: 1.1914 MiB (Also required by: new_relic/agent/configuration)
            new_relic/agent/configuration/default_source: 0.8281 MiB
          new_relic/agent/transaction_event_recorder: 0.4883 MiB
          new_relic/agent/new_relic_service: 0.4336 MiB
          new_relic/agent/commands/agent_command_router: 0.3711 MiB
        new_relic/agent/instrumentation/controller_instrumentation: 0.6406 MiB
          new_relic/agent/transaction: 0.5039 MiB
        new_relic/agent/external: 0.4297 MiB
          new_relic/agent/transaction/tracing: 0.3789 MiB (Also required by: new_relic/agent/transaction)
        new_relic/agent/transaction_sampler: 0.4258 MiB
  activeadmin: 4.8789 MiB
    active_admin: 4.8477 MiB
      active_admin/filters: 2.1094 MiB
        active_admin/filters/forms: 1.1445 MiB
          active_admin/form_builder: 1.0469 MiB
            formtastic/form_builder: 0.4766 MiB
            formtastic/inputs/base: 0.3359 MiB
        active_admin/resource: 0.5547 MiB (Also required by: active_admin/resource/belongs_to)
      active_admin/batch_actions: 1.1094 MiB
        active_admin/application: 1.0977 MiB
          active_admin/namespace_settings: 1.0156 MiB
            active_admin/view_factory: 0.875 MiB
              active_admin/views: 0.7305 MiB (Also required by: active_admin/orm/active_record/comments/views, active_admin/orm/active_record/comments/views/active_admin_comments)
      arbre: 0.9453 MiB
        arbre/html/html5_elements: 0.6172 MiB
      active_admin/orm/active_record: 0.4883 MiB
        active_admin/orm/active_record/comments: 0.4766 MiB
  meta-tags: 4.2305 MiB
    meta_tags: 4.2266 MiB
      action_controller/base: 2.8164 MiB
        action_controller/metal/request_forgery_protection: 0.4805 MiB
        action_controller/metal: 0.3008 MiB
      action_view/base: 0.9727 MiB
        action_view/lookup_context: 0.3242 MiB
  acts_as_votable: 4.0391 MiB
    acts_as_votable/vote: 3.8906 MiB
      active_record/base: 2.9688 MiB
        active_record/enum: 0.4883 MiB
          active_record/type: 0.4414 MiB
        active_record/validations: 0.3281 MiB
        active_record/querying: 0.3125 MiB
      active_record/relation: 0.4922 MiB
      active_record/associations/collection_proxy: 0.3906 MiB
  sass-rails: 3.7578 MiB
    sass/rails: 3.7578 MiB
      sass/rails/helpers: 3.6211 MiB (Also required by: sass/rails/template)
        sass: 3.6172 MiB (Also required by: sass/rails/importer, sass/rails/template, and 3 others)
          sass/engine: 3.1563 MiB
            sass/script: 1.2109 MiB (Also required by: sass/script/css_parser)
              sass/script/functions: 0.3711 MiB (Also required by: sass/script/tree/funcall)
            sass/tree/visitors/cssize: 0.8086 MiB
          sass/version: 0.418 MiB
            sass/util: 0.3516 MiB (Also required by: sass, sass/script/tree/funcall)
  ransack: 3.6055 MiB (Also required by: active_admin)
    ransack/search: 0.8438 MiB
      ransack/nodes: 0.5352 MiB
    ransack/adapters/active_record: 0.7656 MiB
      ransack/adapters/active_record/context: 0.7188 MiB
        polyamorous: 0.6016 MiB
    active_support/core_ext: 0.6836 MiB (Also required by: active_admin)
    ransack/translate: 0.4844 MiB
      i18n/backend/simple: 0.3711 MiB
        i18n/backend/base: 0.3125 MiB
    ransack/helpers: 0.4023 MiB
  carrierwave: 3.2383 MiB (Also required by: carrierwave-aws)
    carrierwave/sanitized_file: 2.7109 MiB
      mime/types/columnar: 2.5977 MiB
        mime/types: 2.5859 MiB
          mime/types/registry: 2.2695 MiB
  devise: 2.5313 MiB (Also required by: devise/async)
    devise/rails: 0.8125 MiB
      devise/rails/routes: 0.793 MiB
        action_dispatch/routing/mapper: 0.6641 MiB
    active_support/dependencies: 0.3828 MiB (Also required by: active_record/base, action_dispatch/middleware/stack)
  pg: 2.1758 MiB
    pg_ext: 2.0703 MiB
      socket: 1.4414 MiB (Also required by: puma, http/options, and 9 others)
        socket.so: 1.3516 MiB
  redis-namespace: 2.0547 MiB
    redis/namespace: 2.0469 MiB
      redis: 1.7852 MiB (Also required by: sidekiq/redis_connection)
  rollbar: 1.5898 MiB
    /Users/marat/.rbenv/versions/2.5.1/lib/ruby/gems/2.5.0/gems/rollbar-2.18.0/lib/rollbar/plugins/thread.rb: 1.5039 MiB
  sendgrid-actionmailer: 1.2344 MiB
    sendgrid_actionmailer: 1.1758 MiB
      sendgrid-ruby: 1.0117 MiB
  mini_magick: 1.1445 MiB
    mini_magick/image: 0.6016 MiB
      open-uri: 0.3047 MiB (Also required by: carrierwave/uploader/download, rollbar)
    mini_magick/tool: 0.4023 MiB
  recaptcha/rails: 0.7422 MiB
    recaptcha: 0.7344 MiB
      net/http: 0.6953 MiB (Also required by: seahorse, net/https, and 4 others)
  draper: 0.707 MiB
    draper/collection_decorator: 0.5938 MiB
  simple_form: 0.5078 MiB
  kaminari: 0.4766 MiB (Also required by: active_admin)
    kaminari/core: 0.3984 MiB (Also required by: active_record/base)
  simple_enum: 0.4531 MiB (Also required by: simple_enum/railtie)
  sidekiq: 0.3594 MiB
By default this task will only return results for the :default and :production groups. If you want some different group you can specify it:
bundle exec derailed bundle:mem development
Also you can check all objects created at Require time
$ bundle exec derailed bundle:objects
Production mode!
Memory leaking in your app Everybody knows about memory leaks, with this tool you can try to find them in your app:
$ bundle exec derailed exec perf:mem_over_time
Just run this in some different amount of times increasing TEST_COUNT step by step, if your app not leaks memory, numbers should be +/- the same.
$ TEST_COUNT=10000 bundle exec derailed exec perf:mem_over_time
https://github.com/SamSaffron/memory_profiler
Simple memory profiler for Ruby.
require 'memory_profiler'
irb(main):001:0> pretty = MemoryProfiler.report do
irb(main):002:1* Job.limit(3)
irb(main):003:1> end
=> #<MemoryProfiler::Results:0x00007f905b0573d0 @allocated_memory_by_gem=[{:data=>"bootsnap-1.3.2", :count=>731248}, {:data=>"activesupport-5.2.2", :count=>18436}
pretty.pretty_print
Let’s see our report:
irb(main):004:0> pretty.pretty_print
Total allocated: 764530 bytes (6823 objects)
Total retained:  441305 bytes (3114 objects)

allocated memory by gem
-----------------------------------
    731248  bootsnap-1.3.2
     18436  activesupport-5.2.2
     14726  activerecord-5.2.2
        80  other
        40  arel-9.0.0

allocated memory by file
-----------------------------------
    411971  /Users/marat/.rbenv/versions/2.5.1/lib/ruby/gems/2.5.0/gems/bootsnap-1.3.2/lib/bootsnap/load_path_cache/cache.rb
    257238  /Users/marat/.rbenv/versions/2.5.1/lib/ruby/gems/2.5.0/gems/bootsnap-1.3.2/lib/bootsnap/load_path_cache/path.rb
     28118
     ...

allocated memory by location
-----------------------------------
    229472  /Users/marat/.rbenv/versions/2.5.1/lib/ruby/gems/2.5.0/gems/bootsnap-1.3.2/lib/bootsnap/load_path_cache/cache.rb:110
    124531
    ...

allocated memory by class
-----------------------------------
    307676  String
    288032  Hash
     43792  File::Stat
     43352  Array
     17424  Binding
     17304  Thread::Backtrace
     15360  Thread::Backtrace::Location
      9640  Bootsnap::LoadPathCache::Path
      9216  Class
      5590  Time
      4048  RubyVM::InstructionSequence
       840  MatchData
       800  Proc
       456  Module
       248  Errno::ENOENT
       240  ActiveRecord::Relation
        80  ActiveRecord::PredicateBuilder::ArrayHandler
        72  Method
        40  ActiveRecord::PredicateBuilder
        40  ActiveRecord::PredicateBuilder::BaseHandler
        40  ActiveRecord::PredicateBuilder::BasicObjectHandler
        40  ActiveRecord::PredicateBuilder::RangeHandler
        40  ActiveRecord::PredicateBuilder::RelationHandler
        40  ActiveRecord::Scoping::ScopeRegistry
        40  ActiveRecord::TableMetadata
        40  ActiveRecord::TypeCaster::Map
        40  Arel::Table

allocated objects by gem
-----------------------------------
      6569  bootsnap-1.3.2
       157  activesupport-5.2.2
        94  activerecord-5.2.2
         2  other
         1  arel-9.0.0

allocated objects by file
-----------------------------------
      3053  /Users/marat/.rbenv/versions/2.5.1/lib/ruby/gems/2.5.0/gems/bootsnap-1.3.2/lib/bootsnap/load_path_cache/cache.rb
      2534  /Users/marat/.rbenv/versions/2.5.1/lib/ruby/gems/2.5.0/gems/bootsnap-1.3.2/lib/bootsnap/load_path_cache/path.rb
       538  /Users/marat/.rbenv/versions/2.5.1/lib/ruby/gems/2.5.0/gems/bootsnap-1.3.2/lib/bootsnap/compile_cache/iseq.rb
       316
       ...

allocated objects by location
-----------------------------------
      2312  /Users/marat/.rbenv/versions/2.5.1/lib/ruby/gems/2.5.0/gems/bootsnap-1.3.2/lib/bootsnap/load_path_cache/cache.rb:139
      1171  /Users/marat/.rbenv/versions/2.5.1/lib/ruby/gems/2.5.0/gems/bootsnap-1.3.2/lib/bootsnap/load_path_cache/path.rb:28
       834
       ...

allocated objects by class
-----------------------------------
      5160  String
       608  Array
       241  Bootsnap::LoadPathCache::Path
       240  Thread::Backtrace::Location
       238  File::Stat
       198  Binding
        65  Time
        13  Class
        11  Hash
        10  Proc
         9  RubyVM::InstructionSequence
         9  Thread::Backtrace
         3  Errno::ENOENT
         3  MatchData
         2  ActiveRecord::PredicateBuilder::ArrayHandler
         2  ActiveRecord::Relation
         1  ActiveRecord::PredicateBuilder
         1  ActiveRecord::PredicateBuilder::BaseHandler
         1  ActiveRecord::PredicateBuilder::BasicObjectHandler
         1  ActiveRecord::PredicateBuilder::RangeHandler
         1  ActiveRecord::PredicateBuilder::RelationHandler
         1  ActiveRecord::Scoping::ScopeRegistry
         1  ActiveRecord::TableMetadata
         1  ActiveRecord::TypeCaster::Map
         1  Arel::Table
         1  Method
         1  Module

retained memory by gem
-----------------------------------
    427126  bootsnap-1.3.2
     12718  activerecord-5.2.2
      1461  activesupport-5.2.2

retained memory by file
-----------------------------------
    397860  /Users/marat/.rbenv/versions/2.5.1/lib/ruby/gems/2.5.0/gems/bootsnap-1.3.2/lib/bootsnap/load_path_cache/cache.rb
     24234
     ...

retained memory by location
-----------------------------------
    229472  /Users/marat/.rbenv/versions/2.5.1/lib/ruby/gems/2.5.0/gems/bootsnap-1.3.2/lib/bootsnap/load_path_cache/cache.rb:110
     92521
     ...

retained memory by class
-----------------------------------
    287336  Hash
    142385  String
      9216  Class
       912  Array
       560  Proc
       456  Module
        80  ActiveRecord::PredicateBuilder::ArrayHandler
        40  ActiveRecord::PredicateBuilder
        40  ActiveRecord::PredicateBuilder::BaseHandler
        40  ActiveRecord::PredicateBuilder::BasicObjectHandler
        40  ActiveRecord::PredicateBuilder::RangeHandler
        40  ActiveRecord::PredicateBuilder::RelationHandler
        40  ActiveRecord::Scoping::ScopeRegistry
        40  ActiveRecord::TableMetadata
        40  ActiveRecord::TypeCaster::Map
        40  Arel::Table

retained objects by gem
-----------------------------------
      3041  bootsnap-1.3.2
        60  activerecord-5.2.2
        13  activesupport-5.2.2

retained objects by file
-----------------------------------
      2774  /Users/marat/.rbenv/versions/2.5.1/lib/ruby/gems/2.5.0/gems/bootsnap-1.3.2/lib/bootsnap/load_path_cache/cache.rb
       203
       ...

retained objects by location
-----------------------------------
      2312  /Users/marat/.rbenv/versions/2.5.1/lib/ruby/gems/2.5.0/gems/bootsnap-1.3.2/lib/bootsnap/load_path_cache/cache.rb:139
       460
       ...

retained objects by class
-----------------------------------
      3058  String
        19  Array
        13  Class
         7  Proc
         5  Hash
         2  ActiveRecord::PredicateBuilder::ArrayHandler
         1  ActiveRecord::PredicateBuilder
         1  ActiveRecord::PredicateBuilder::BaseHandler
         1  ActiveRecord::PredicateBuilder::BasicObjectHandler
         1  ActiveRecord::PredicateBuilder::RangeHandler
         1  ActiveRecord::PredicateBuilder::RelationHandler
         1  ActiveRecord::Scoping::ScopeRegistry
         1  ActiveRecord::TableMetadata
         1  ActiveRecord::TypeCaster::Map
         1  Arel::Table
         1  Module


Allocated String Report
-----------------------------------
        42  ""
        22  /Users/marat/.rbenv/versions/2.5.1/lib/ruby/gems/2.5.0/gems/bootsnap-1.3.2/lib/bootsnap/load_path_cache/path.rb:76
        16
        ...

Retained String Report
-----------------------------------
         1  "#<Class:ActiveRecord::Scoping::ScopeRegistry>#value_for delegated to instance.value_for, but instance is nil: "
         1  /Users/marat/.rbenv/versions/2.5.1/lib/ruby/gems/2.5.0/gems/activesupport-5.2.2/lib/active_support/core_ext/module/delegation.rb:214
         ...
Super detailed report for each part of your app, allocated memory by class, by location, by file and gem. Amazing! Spend some time with digging into it.
You can add gem into Gemfile and check the report as well.
Add gem ‘memory_profiler’ to your Gemfile, then change config/environment.rb:
require_relative 'application'

MemoryProfiler.report do
  require File.expand_path('../application', __FILE__)
  Rails.application.initialize!
end.pretty_print(to_file: "test_report.txt")
Super simple and useful!
Thats all guys, I’ll add next chapters about my experience and diving into debugging and profiling ruby apps later. Many thanks for the authors who inspired me and materials which I used on this post,
- AMAZING book from Nate Berkopec ‘The complete guide to rails perfomance’, https://www.railsspeed.com - please buy his book and course
- ScoutApp and their blog: https://scoutapp.com/blog/which-rails-profiler-is-right-for-you
- Justin Weiss https://www.justinweiss.com/articles/a-new-way-to-understand-your-rails-apps-performance
- Codementor post https://www.codementor.io/victor_hazbun/rack-mini-profiler-for-the-win-kq00prump